If you're searching for what to do with your employee engagement survey results, you may be disappointed to find that most advice starts after you've gone through the results and are ready to share with your team. But that's jumping the gun.
Before you start sharing your results and implementing changes, you need to make sense of the data you've been given — otherwise, you're guesstimating problems and solutions. So once employee survey results are in, but before you share your plans with the team, here's what you need to do.
{{rich-takeaway}}
Analyze the Results
You’ve just received your employee engagement survey results. While the software you used might provide an overall score or average, you need to go a bit further. There’s a lot of nuance to employee sentiment, and on-the-ground realities can vary widely from team to team. What’s more, visualizing the data can reveal trends in ways that static spreadsheets can’t.
You don’t need to be a data scientist to pull insights from survey data. Here’s how to get an accurate read on the state of your workplace.
1. Look at cross-sections and performance.
After looking at your overall, company-wide results, break responses down by different departments and demographics. For this to be possible, it’s important that your survey data includes all of the right fields. If you use a data-driven engagement survey platform like Lattice, make sure you account for all the different dimensions you want to consider before launching the survey.
Consider a few different angles. Do your older workers report feeling excluded from the company’s culture? Does employee satisfaction vary by job level or pay grade? You can’t identify these trends without having these fields in place. To that end, this analysis gives you a great opportunity to note what fields you’d like to add to your dataset for future surveys.
Here are some dimensions you should consider when starting your data analysis:
- Age
- Department or business unit
- Ethnicity
- Gender
- Job category (full-time, part-time, contractor)
- Job level
- Months since the last title change
- Office location
- Salary band
- Tenure
Comparing results across each of these will help you prioritize your next steps and potentially get ahead of voluntary turnover. Factoring in employee performance can also put the survey results in a different light. Are your star performers scoring low on wellbeing? That could be reason enough to sound the alarm with department leadership. In cases like these, HR technology can help your team identify flight risks. Lattice Analytics makes it easy to cross-reference engagement and performance data in one dashboard.
2. Read the comments.
Scores might be telling on their own, but what better way to gauge sentiment than to read what employees have to say? While you can make comments optional, they should never be absent from your survey altogether. They provide you with the most direct feedback, and subtleties like tone and word choice can convey more than any percentage or rating ever could.
If you’re at a small business, skimming the comments might be a lunchtime activity. But for companies with hundreds or even thousands of team members, it can take teams days to read them, let alone identify recurring themes.
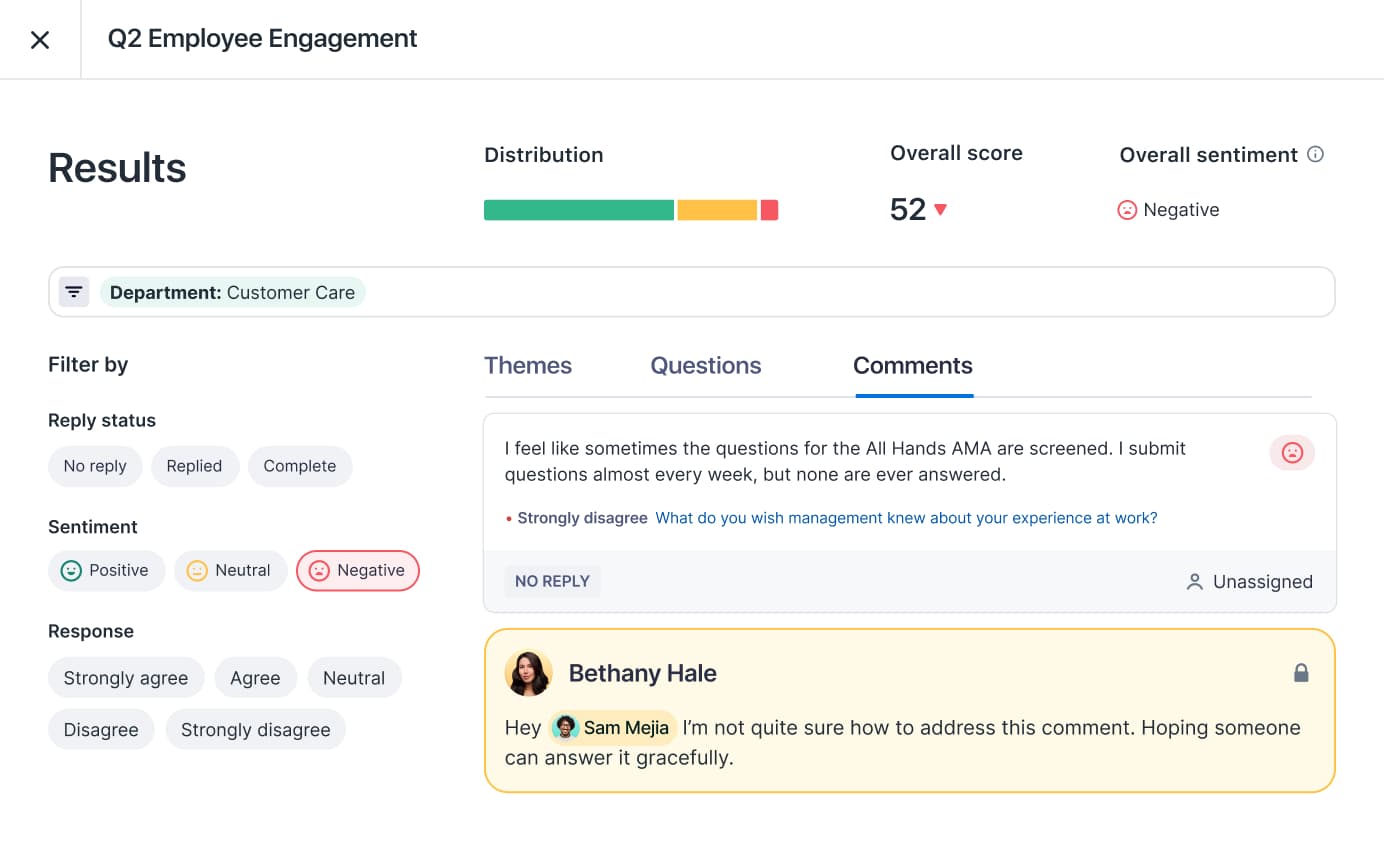
HR technology can help you uncover even more. Artificial intelligence and machine learning make it easier to not just identify recurring words, but also the emotions behind them. Sentiment analysis empowers HR teams to identify positive, neutral, and negative responses en masse.
While it might be tempting (and only natural) to hone in on the negative comments, listen to your promoters as well. That positive feedback can serve as your north star and inform how you address weaknesses or challenges in the action-planning phase.
3. Compare historical data.
More data, more insights. Tracking employee experience and engagement survey data over time gives you a clear picture of whether things are improving or not. Sure, it might be disheartening to see that only 45% of employees consider your company a great place to work. But what if that statistic was just 20% last quarter? The changes you’ve made are working — build on that momentum. That comparative data is important to know when you start drafting an action plan.
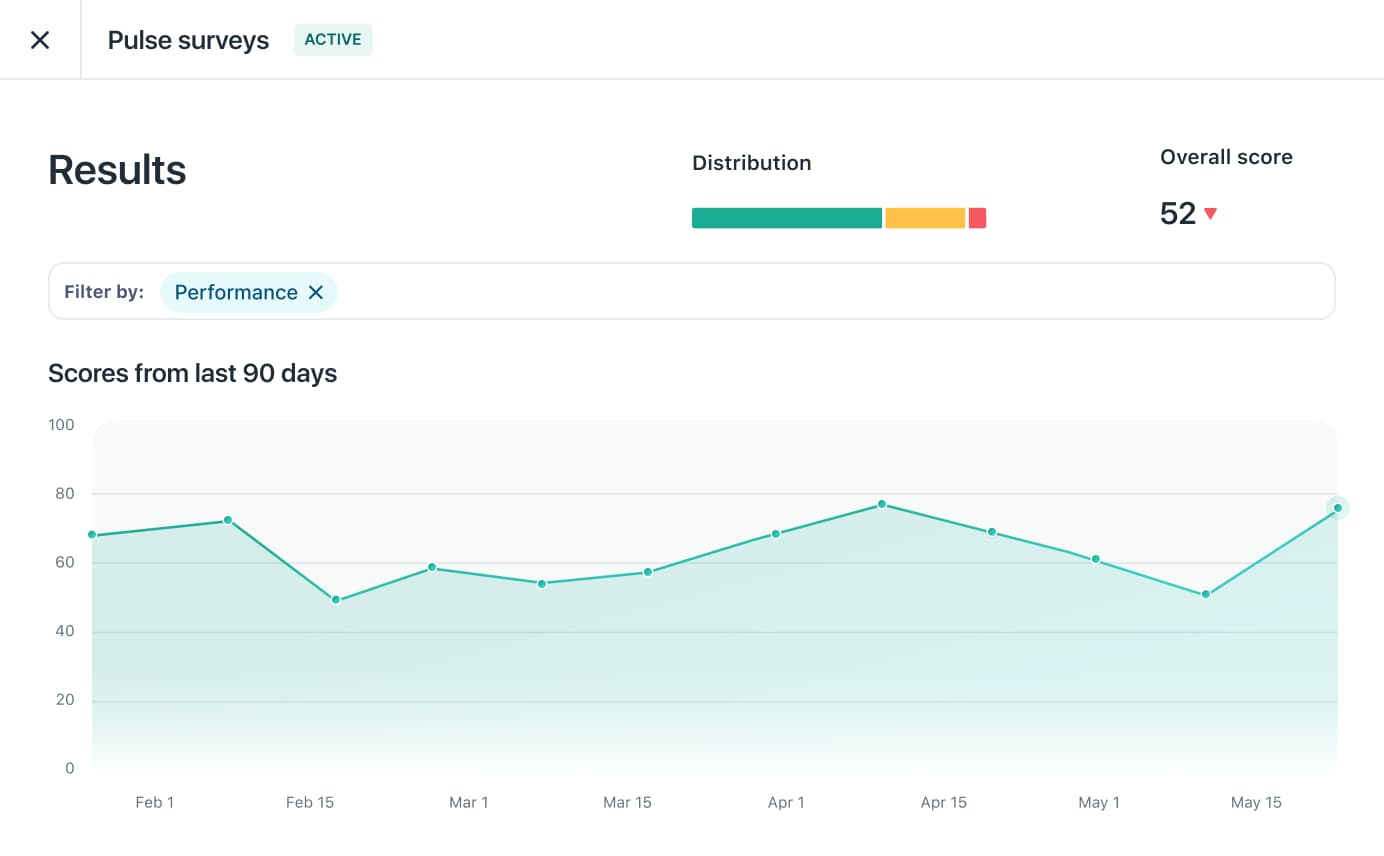
Looking at historical data can also reveal seasonal trends. Let’s say your company’s busiest season is year-end. If you run surveys on a quarterly basis, are your fourth-quarter results typically on the lower side? While you should never discredit employee feedback, it’s important to know that sentiment ebbs and flows throughout the year and is also influenced by business performance. If your results mark a complete departure from past surveys in the same timeframe, that should stick out like a sore thumb.
4. Benchmark your results.
What does “good” look like, anyway? Companies seldom share their engagement data with the general public, so it can be hard to tell.
In the past, wrangling this information was easier said than done. It meant privately asking your professional network, reading industry studies, or even purchasing costly benchmark reports. Using a survey tool like Lattice Engagement empowers you to benchmark your results against the other companies’ data. Our platform allows you to do this for specific employee engagement survey questions and your overall results.
When comparing your results to industry benchmarks, remember to carefully consider your response rate and sample size. For example, if a specific question was filled out by a small subset of workers, don’t be surprised if your results seem way off the mark. Similarly, if your survey is highly customized and includes questions that don’t typically apply to other businesses, you’ll have less data to compare.
5. Use visuals to spot trends.
Static spreadsheets only reveal so much. Using visuals can help you focus on problems and areas of improvement. They can also tell the story of your engagement survey in ways traditional metrics can’t, making them powerful assets for your next boardroom presentation. Some of the most impactful visuals involve looking at cross-sections of your workforce. For example, try looking at your survey responses by manager or department.

Don’t shy away from experimenting with less conventional charts. Import your results and comments into data visualization tools for even more insights. Apply the same creativity to other HR data points, like performance ratings and attrition, and you might make even more surprising discoveries.
Building an Action Plan
You’ve had time to digest the results. What do you do with your engagement survey results next? Now it’s time to share what you’ve learned with the leadership team and managers. At the end of this exercise, you’ll have a clear sense of what needs to be prioritized and a list of positive changes that you can make. For a presentation template based on these guidelines, click here.
1. Share the results with leadership.
Whether you’re running open enrollment or launching a company policy, communication is a critical skill set in HR. That’s especially true when it comes to sharing something as sensitive as survey results and employee comments.
Start the presentation by reminding leadership of why you conduct employee engagement surveys in the first place. Cite the statistical data correlating engagement to business results and the importance of your employer brand on attracting talent. According to engagement research from Gallup, some of those more tangible impacts include:
- 21% higher profitability
- 20% higher sales
- 17% higher productivity
- 10% higher customer metrics
- 24% lower turnover in high-turnover organizations
- 59% lower turnover in low-turnover organizations
- 40% fewer defects
- 41% less absenteeism
- 58% fewer patient safety incidents
- 70% fewer employee safety incidents
If you surveyed for topics like belonging and employee Net Promoter Score, also mention why each of those matters to the business. While you’d be hard-pressed to find leaders who don’t buy into the value of these, it’s still worth providing this context.
Next, talk about who took the survey. What did participation look like by department? Remind your audience that the response rate can be a misleading indicator of success. Achieving a high participation rate is important, but if it’s too high it can suggest employees were pressured into completing the survey. According to Lattice benchmarking data, the average response rate is 74%. Aim higher, but don’t be disappointed if you fall short of 100%.
Now that you’ve walked through your survey process and methodology, now it’s time to get into the meat of your presentation: the results. Run through the themes of your latest survey. How did you fair for criteria like “commitment to the company?” Did results vary significantly by department compared to last year? For additional context, note whether these numbers changed since the prior survey. If you have access to industry benchmarks, include them to give your audience a sense of how typical or atypical your results are.
You can give leaders and managers additional insight by following up with how employees responded to specific questions within each category. For example, were employees more favorable about certain aspects of management? Your leaders might be giving employees actionable feedback, but not giving enough direction in the form of clear goals. This data starts to get to the “why” of your results.
Now that you’ve gone through high-level details, it’s time to share your “aha” observations or hypotheses. This is where your earlier analysis comes into play. If you noticed anything compelling with regard to employee demographics, tenure, or other dimensions, highlight those observations. Content permitting, you should include employee comments that help color the findings and give your audience greater context. Their qualitative nature also grounds the results in reality. If you use an engagement survey software like Lattice Engagement, you can paste visuals from the platform into the presentation for additional emphasis.
{{rich-highlight-1}}
2. Identify your priorities.
You’ve gone through key findings and hypotheses with leadership — now it’s time to identify the next steps and tackle opportunities for improvement.
No company is perfect, and even glowing reviews from employees leave room for improvement. Whatever your reality, don’t bite off more than you can chew. First, determine which opportunities need to be prioritized. Using a matrix, identify your important weaknesses and strengths. You may opt to make this a collaborative exercise with leadership and managers in the room. Doing so has the added effect of getting buy-in from the same individuals who, in many cases, will be responsible for the success or failure of the resulting action plan.
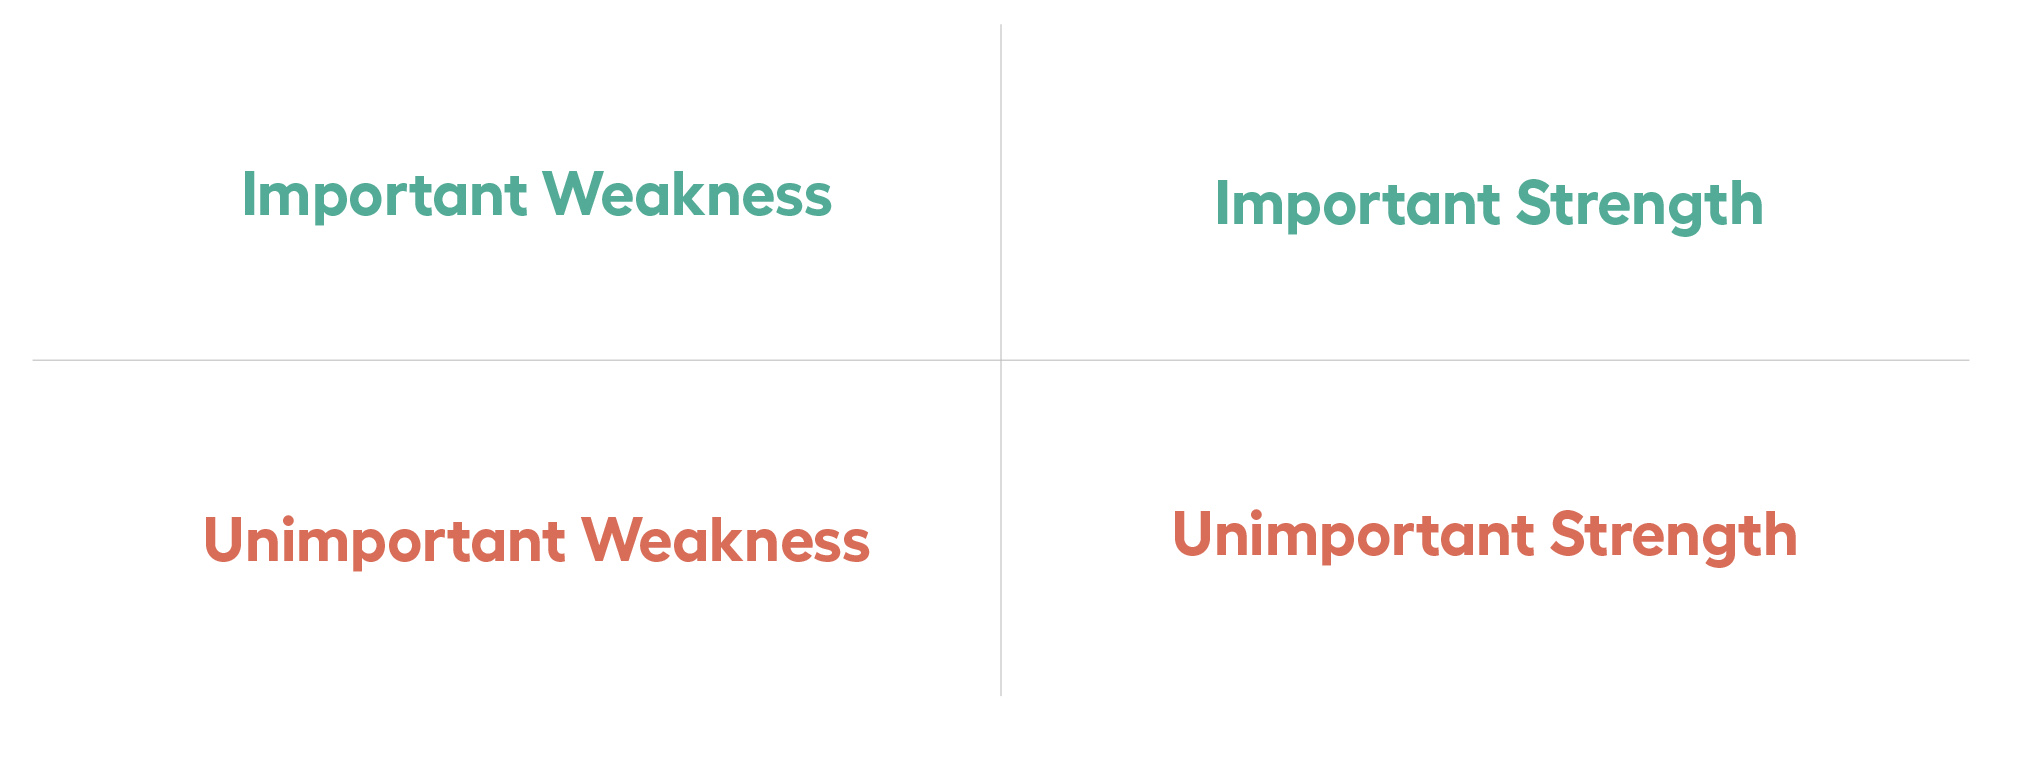
The matrix is intuitive enough: Items listed in the bottom quadrants should be shelved, and strengths and weaknesses in the top half prioritized. Your important strengths serve as your guiding light — a reminder of what your company excels at. Consider why these are your strengths and whether there are any practices or lessons that can be applied to your weaknesses.
Next, pick three to five weaknesses to focus on. Any more and you risk spreading management’s focus too thin. Under each weakness, propose potential solutions. You may come to the meeting with your own ideas, but once again it’s important to give managers a role in crafting solutions on their own.
Here are three example, actionable insights and their potential, high-level solutions. Keep in mind that these aren’t goals — we’ll get to those shortly. If you subscribe to the OKR approach to goal setting, consider these akin to objectives, not key results.
| Example Insights |
|---|
| GTM employees feel disconnected from the product team. This tends to happen at high-growth work environments. Encourage managers from these two teams to improve communication. Asking them to share updates with the broader organization or co-own certain goals could boost collaboration. |
| Managers in the Seattle office report lower team engagement. In can be difficult keeping satellite offices engaged and feeling like part of the company. Roll out a cross-office public praise initiative to recognize remote or distributed employees. |
| High-performers on the client service team report lower engagement. This could be a future employee retention issue. Have managers speak with these employees to gather more context, and encouraging frequent and detailed one-on-one meetings and praise from their manager. |
3. Set actionable goals.
Identifying problems and high-level solutions is an important step, but it’s just a preliminary one. Using these as a starting point, you’ll need to formalize goals so owners have something to work from. Setting goals will also give employees, who want to see their feedback result in change, something to track progress with.
“Improve communication between departments” is a worthy aspiration, but it’s also a vague one. You need to divide aims like these into more actionable, measurable goals. There are a few different methodologies you can use, including the “SMART” model. This acronym stands for smart, measurable, actionable, relevant, and time-bound. As you divide your high-level responses into smaller goals or key results, consider whether each fulfills these criteria:
- Specific: Does the goal have specific means and ends?
- Measurable: Can the goal be measured? How?
- Actionable/Achievable: What are the specific actions that will lead to the goal? What do you need to do to accomplish it?
- Relevant/Realistic: Is this goal relevant to your team and company? Is it based on factors that are under your control?
- Time-bound: What is the time period? Does it depend on a deadline or target date, or is it on a regular schedule?
If employees feel like they’re in the dark about what other teams are working on, consider a goal like, “Launch and send at least five cross-departmental email newsletters this quarter.” Because the goal is specific, it lends itself to being assigned to an owner and acted on immediately. The clearer the goal, the easier it is to get it assigned and rolling without superfluous kickoff meetings or brainstorms. To help get you started, here are some example scenarios and their respective goals.
| Example Goals |
|---|
Opportunity: Only half of respondents think managers are invested in their growth.
|
Opportunity: Employees feel like they aren’t being recognized for their work.
|
Opportunity: Remote offices feel excluded.
|
Opportunity: Only half of employees would recommend their manager.
|
While HR can help move the needle on things like stipends and manager training, some goals will be specific to certain departments and teams. For example, your survey might reveal hostility between divisions in your sales team. In cases like these, play the role of advisor and partner with managers to draft SMART goals that get to the heart of the issue.
4. Share your plan.
Once you’ve formalized goals with your leadership team and management, share your survey results and action plan with employees at large. Pairing the two will show you intend to act on their feedback in specific, measurable ways. Doing so will have the added effect of giving managers and goal owners an extra nudge to take their next steps seriously.
Once you’ve shared your action items, add them to your people management platform as goals. Lattice's OKRs software allows managers and goal owners to easily provide updates and gives employees a place to periodically check in on progress. What’s more, if you need to provide the C-Suite with a quick update on your employee survey response, you can just take a snapshot from the platform.
—
When you ask employees to complete an engagement survey, they trust that their answers will be used to improve the workplace. If you don’t make good on that promise, running surveys might actually do more harm than good. But getting to that next step is often easier said than done — which is why so much has been written about crafting surveys, not how to respond to them.
Remember, people strategy is business strategy. Like any conventional sales or revenue target, engagement can be tackled by looking at the data, setting goals, and remembering to follow up. And thanks to technology, human resources teams have never been better equipped to execute on that promise.
Lattice is here to help. We bring engagement, performance, and goals together in one place. Thousands of companies use our people management platform to develop engaged, high-performing teams. Learn how we can help you deliver on your latest engagement survey and schedule a Lattice demo.
Our free HR Metrics Slide Deck Template includes 50+ editable charts and covers most key HR metrics, from headcount to time-to-fill.
Key Takeaways:
- Engagement scores become more actionable when they’re compared against cross-sections like departments, demographics, and performance ratings.
- Reading survey comments takes time but is invaluable for specific, key drivers of engagement and disengagement.
- Consider that levels of engagement may vary over time, based on business performance and seasonality.
- As you would for any business objective, set goals around your survey action plans. Update the goals regularly to keep an open dialogue.