
We’ll level with you: Employee Net Promoter Score (eNPS) doesn’t exactly roll off the tongue. It sounds like a TV network, not a people metric.
But this well-known calculation has become a fast, effective way for organizations to take the temperature of their employee sentiment and understand where their biggest workforce challenges lie.
The key is understanding what it means, and knowing how to pair it with the right data to tangibly improve employee retention and engagement.
What is eNPS and why does it matter?
ENPS is a metric that reflects employee satisfaction at work. It assesses how likely employees would be to recommend their organization to their friends and family.
The metric takes its origins from the early 2000s, when leaders at management consulting firm Bain & Company wanted a simple, representative way to measure customer satisfaction.
They came up with Net Promoter Score — known as NPS — which is used to gauge customers’ loyalty and likeliness to recommend a company, product, or service.
Since then, NPS has been adapted into eNPS as a helpful metric that gives organizations a barometer for employee engagement and loyalty.
In practice, eNPS is widely adopted because it’s easy to run consistently. When asked regularly, it can be an early warning system for shifts taking place in your workforce — flagging changes like disengagement, burnout, or company culture issues, before they show up as bottom line impacts like increased employee turnover.
But because it functions more like a direction of travel rather than a diagnostic tool, eNPS should be considered as more of a “what” metric that highlights changes in sentiment. Getting to the “why” and building responsive engagement strategy relies on pairing it with broader employee engagement and performance data.
The eNPS Question
Measuring eNPS relies on asking one simple question: On a scale of 0–10, how likely are you to recommend [company] as a place to work?
It may sound simplistic, but there’s beauty in that simplicity, because eNPS is particularly effective at giving organizations a consistent, high-level view of how their workforce feels about their organization.
{{rich-highlight-2}}
In addition to the eNPS question, organizations can also ask open-ended follow-up questions that help them gain valuable insights from their workforce about broader themes impacting employee engagement:
- What is the primary reason for your answer?
- What one thing could we do differently to improve?
- What prevents you from giving a higher score?
- How can we improve your day-to-day work?
Why Consistency Matters for eNPS
For eNPS to work as a reliable metric, the question wording and rating need to stay consistent across surveys.
Changing either could introduce ambiguity and bias, making your data unreliable. The 0–10 scale ensures that employee responses are weighted accurately when calculating your score (we’ll get to this in more detail in the calculation section).
This standardization also enables organizations to benchmark their eNPS score against their own scores, as well as industry peers or other similar-sized businesses. This helps HR and talent acquisition teams contextualize their performance and internal trends against external labor market conditions.
How to Calculate eNPS
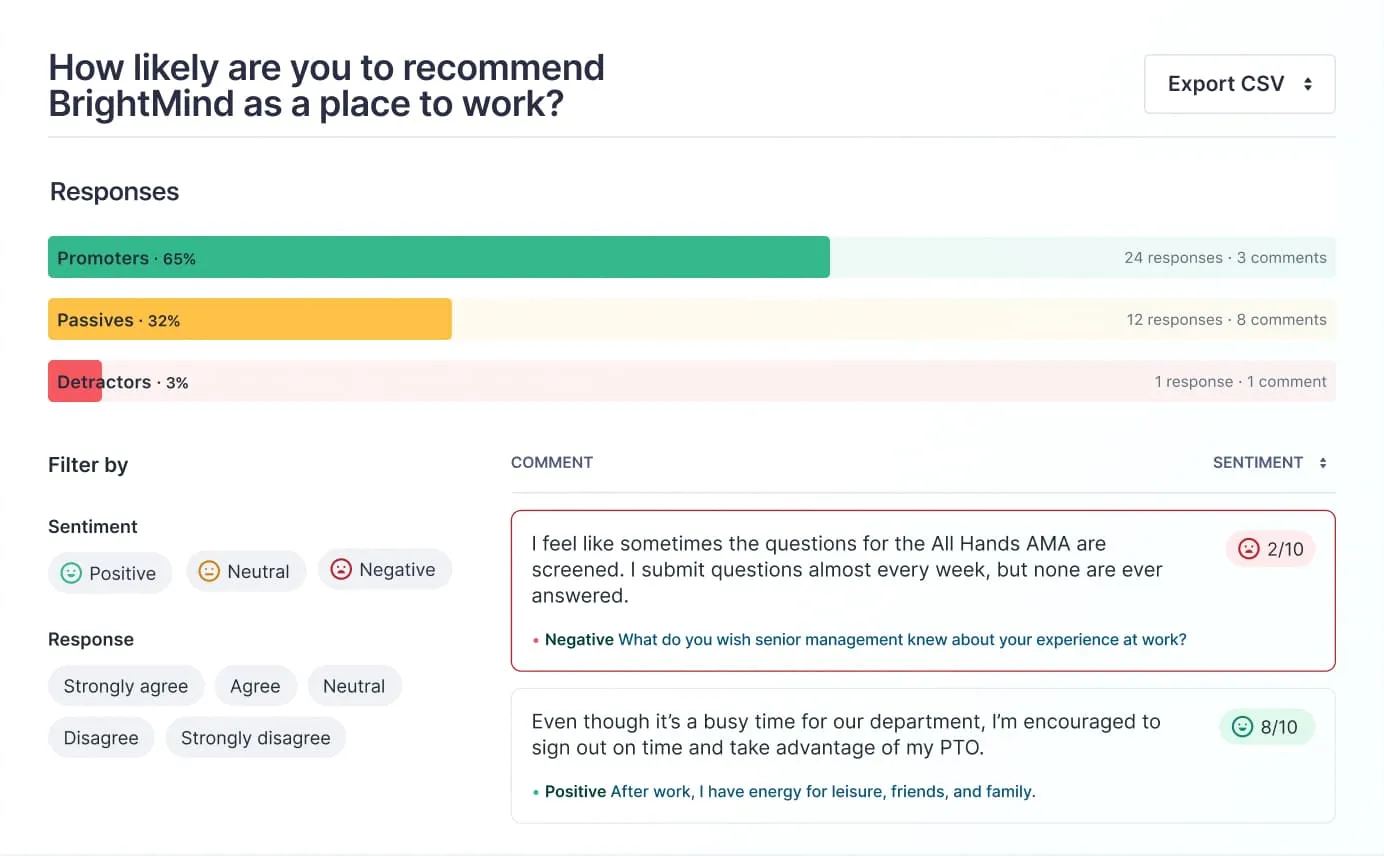
Calculating your eNPS score works by first breaking your survey respondents down into three key groups:
- Promoters: Promoters are employees who score between 9 and 10. They’re your biggest ambassadors and advocates and most likely to recommend your organization as a great place to work.
- Passives: Employees that score between 7 and 8 are seen as passives. They’re the definition of a shrug — and while they might not be on a job-hunting spree yet, they could be if organizations aren’t ready to act to keep them.
- Detractors: Detractors are employees that score anywhere between 0 and 6. These employees are the actively unhappy ones among your population — the ones most likely to leave a damaging review on your Glassdoor.
Unlike other engagement metrics, the eNPS score calculation isn’t based on averages. It’s based on the premise that one bad apple can spoil the bunch — so the scale is weighted towards detractors, rather than being evenly balanced through all three groups.
The actual eNPS calculation works by subtracting your percentage of detractors from your percentage of promoters. The resulting value is your company’s eNPS. See the calculation:
{{rich-highlight-1}}
If you use Lattice, our employee survey software will handle this calculation automatically.
What’s a “good” eNPS score?
ENPS results can range from -100 to +100. A negative score indicates that you have more detractors, and a positive score indicates more promoters.
Here are some typical benchmarks that give organizations a rough guide of what ‘good’ looks like:
- +10–30: Healthy, with room to improve
- +30–50: Strong — most employees feel positive about their organization
- +50 and over: Exceptional, with sustained positive sentiment over time.
In general terms, what makes a “good” score is entirely dependent on your organization’s industry, company size, and geography. Some cultures, for example, might be predisposed to be more positive than others — which can skew how they respond to the eNPS question. By the same token, smaller organizations tend to report higher scores compared to large ones, because of closer relationships and fewer hierarchical layers.
The bottom line is that the number matters less than its overall trajectory.
"It's so easy to obsess over the number,” said Colby Nesbitt, PhD, director of talent management and people analytics at Lattice. “A lot of times people get stuck when they want a simple answer to the question: 'so...is that good or bad?' But the reality is always more complex than a single score, or a benchmark to compare it to. When you fixate on the score, you're more likely to miss the insight it's pointing to and overreact or underreact."
Common Mistakes to Avoid
ENPS is simple enough to understand in theory, but can be easy to misuse in practice — especially when you get hooked on the number, not the meaning behind it. Here are three common pitfalls to avoid when calculating your eNPS.
1. Over-Relying on a Single Score
ENPS tells you part of the story of how your organization is currently feeling. But it’s not the whole picture, and it doesn’t tell you the specific factors that can shape employee sentiment, or where to focus your efforts.
What to do instead: Track trends over time and pair eNPS data with other engagement drivers like manager effectiveness or psychological safety to keep a pulse on what’s happening and why.
The companies that get consistently strong participation treat engagement like an ongoing dialogue rather than a once-a-year event.
2. Failing to Close the Loop with Employees
Employees won’t keep participating in your eNPS survey (or any other surveys) if their answers disappear into the void and they hear nothing back. Closing this feedback loop shows them that they’re being heard.
What to do instead: Make sure you share what you’ve learned from your survey responses and what you plan to do about them in real time. When employees can see you’re taking action, they’re more likely to buy into future survey rounds, upping your response rate.
3. Reacting too Strongly to Short-Term Dips
When your eNPS score takes a tumble, it’s tempting to want to fix it immediately. But knee-jerk responses risk wasting time and resources that won’t solve the underlying problem — meaning you end up fixing symptoms, not addressing root causes.
What to do instead: Don’t panic over quarter-to-quarter fluctuations. Instead of looking for short-term dips, look for sustained trends over multiple survey cycles before implementing any major changes.
When and How to Send eNPS Surveys
Capturing great quality eNPS data is all in the timing.
Ask people too often, and they’re likely to come down with a debilitating bout of survey fatigue. Too infrequently, and you’re only capturing a momentary snapshot of how your workforce is feeling.
Quarterly or biannually seems to be the Goldilocks sweet spot for most — providing enough data to track trends while encouraging strong response rates. Tools like Lattice Pulse can help automate this effort and handle survey timing so teams don’t get mired in scheduling complexity.

But for the greatest impact, include your eNPS question as part of your regular pulse or engagement surveys rather than in a 50-question marathon at the end of the year. Because that’s where you’ll get the high quality survey response rates and employee feedback that will point you to the real pain points among your workforce.
"The companies that get consistently strong participation treat engagement like an ongoing dialogue rather than a once-a-year event,” Nesbitt explained. “They share the results openly — even (or especially!) when the scores aren't all favorable, because it communicates 'we heard you.' They close the loop by communicating how feedback has shaped decisions.”
In other words, employees care when they can see that you do. But this doesn’t work without a baseline of trust. To participate fully, employees need to know that their anonymity will be protected — and that nobody will come after them about their feedback.
A smart approach is to tackle a couple of low-lift wins to build momentum, clearly communicate that you acted on that feedback, and then double down on one or two bigger, strategic initiatives.
How to Use eNPS Results
The survey results are in, so what do you do next? Your score is just the starting point — now it’s time to run the numbers, identify what’s strong and what needs help, and build the action plan to match.
Here are four ways to turn your eNPS data into actionable insights.
1. Identify trends by team, tenure, and role.
Your first step when wading into your eNPS results is segmenting your data by different workforce factors including team, tenure, and role. This will give you a birds-eye view of exactly where your high-performing areas are — and where you could use a little help.
Segmenting your score by tenure, for example, could tell you that new hires and long-tenured employees are more likely to be promoters, while those between one and three years might just be looking for an out.
Looking at a cross-section of your departments, teams, or business units will show you where you have localized pockets of cultural issues, rather than company-wide problems.
In any case, segmenting your data gives you a jumping-off point to explore more — and find out the root causes behind a score change. And once you’ve identified where teams could use more support, it’s a great time to empower managers to lead the conversation in their own teams.
“[One thing] that's really effective is to coach managers to use engagement results,” Nesbitt said. “At the team level, it's really helpful to use engagement scores as the starting point for a conversation and build psychological safety so teams can share feedback all year long."
{{rich-highlight-4}}
2. Compare against historical data, not just benchmarks.
While benchmarking your organization against other similar companies might seem tempting as a first port of call, the best organization to pit yourself against is…yourself.
A +20 score might look reassuring, but if your organization was at +45 just six months ago, then it’s a signal that you have some challenges you need to address.
Seeing what’s trending up and down over time can give you a sense of when changes are taking place, meaning you can connect them to shifts across the organization — like a new senior leader joining — or broader events that could impact employee loyalty.
3. Pair eNPS with engagement data to understand root causes.
ENPS is a great directional tool — but alone, it can’t tell you much about where to act. Diagnosing where your challenges are and getting to their root causes relies on pairing eNPS with qualitative and quantitative insights from your engagement survey.
But how do you know what to prioritize?
"This is where a driver analysis is super valuable — it shows which factors are most closely connected to eNPS, so you can focus on the actions with the highest ROI," Nesbitt explained. "You can't (and shouldn't) act on everything, and trying to do too much often backfires. A smart approach is to tackle a couple of low-lift wins to build momentum, clearly communicate that you acted on that feedback, and then double down on one or two bigger, strategic initiatives.”
Scores on driver-based questions and survey comments can point you to issues harming your employee experience, helping you launch initiatives that actually improve engagement and retention long-term. But the biggest impact doesn’t always come from bells and whistles initiatives — sometimes it’s at the team-level.
“Company-wide themes matter, but acting locally is just as important when certain teams have unique needs,” Nesbitt explained. But there’s an important balance to strike between letting every team do their own thing, and keeping teams generally aligned. “Whenever possible, incorporate engagement action planning into company-wide goals planning and reporting cadences so you're not creating a separate process — you're simply adding engagement into the definition of how a successful, healthy company operates."
{{rich-highlight-5}}
4. Connect eNPS to business outcomes.
Beyond engagement survey data, eNPS can unearth patterns that you might otherwise miss when it’s plugged into business insights.
"ENPS becomes much more valuable when you pair it with other lifecycle and business data,” Nesbitt explained. “You can treat it almost like a proof point and explore how it connects to outcomes like quota attainment, performance, retention, or employee referrals.
“Linking it with other signals of manager effectiveness or team health can reveal hotspots or bright spots you wouldn't see otherwise. When those pieces come together, you get a much clearer picture of why sentiment looks the way it does, what the impact is, and where action will actually move the needle."
{{rich-highlight-6}}
Turn Feedback into Meaningful Change
ENPS is an effective tool that helps organizations get a sense of their overall engagement levels. It’s a simple barometer for how employees are feeling that gives organizations an advance warning that storms might be on their way.
But if organizations use it alone, they risk oversimplifying what’s actually happening in their workforce. Its biggest value comes from how organizations use it to see the broader business picture — connecting it to real-time business and employee lifecycle insights that crystallize what matters most, and how to act.
Lattice was built to help your team unearth exactly these insights. Lattice Engagement embeds eNPS within pulse and engagement survey templates. HR teams can track data trends over time in dashboards, and managers can take action on their feedback.
Want to find out how Lattice can help you measure employee sentiment and optimize your eNPS? Book a demo.
eNPS Formula
Employee Net Promoter Score = % Promoters - % Detractors
Lattice Engagement makes eNPS a breeze.
See how Lattice helps HR teams gather real-time feedback with a free tour.
🛠️ Tool tip: Lattice Engagement automatically calculates this score for you.
Bogged down with comments? We can help.
Read our free ebook to learn how Lattice AI can help your team move faster when responding to employee feedback.
Ask the right questions.
Need a primer on what to ask in your upcoming survey? Grab our free Employee Engagement Survey Template.
We love the ability to quantify where our employees stand in terms of themes in pulse and eNPS surveys. [Lattice] gives us the ability to have clear insight into our employee base and empowers us to create solutions to address challenges.
Lucy Maresco, VP People, CoEnterprise