

If you’re like many HR professionals, you probably chose this field for the people, not the numbers. But whether data is your strength or stretch area, analytics are an essential part of any modern human resources strategy. The right metrics help you spot positive and negative trends, solve problems, and drive better performance outcomes and business success. They also enable smarter, data-driven decisions about your workforce and strengthen your voice at the leadership table.
Whether you love diving into dashboards or break into a sweat at the sight of a pivot table, this guide will walk you through the most important HR metrics — what they are, why they matter, and which HR metrics you should be tracking to improve your workplace.
What are HR metrics?
HR metrics are data points and calculations used to track and measure the performance of HR initiatives, providing deeper insight into your workforce. They help quantify the employee experience, track trends, and uncover underlying issues that may affect employee engagement, performance, retention, and organizational health. By tracking HR data and metrics over time, your team can make more informed decisions, demonstrate the impact of your HR initiatives, and continuously improve your workplace experience and culture.
Why are HR metrics important?
HR metrics provide the data and insights your team needs to drive continuous improvement across key areas of the employee experience and overall organizational health, including:
- Talent management: HR metrics can track employee engagement and sentiment, helping your organization understand what’s working and where you can improve life at your company. This helps you keep employees happy, productive, and fulfilled.
- Budget and cost management: Analyzing metrics like turnover rate and cost-per-hire helps identify opportunities to improve efficiency and manage recruiting costs more effectively.
- Strategic planning: Data-driven insights help you anticipate workforce needs, align talent strategies with current and future business goals, maintain optimal staffing levels, and support long-term organizational growth.
- Analyzing the impact of initiatives: Tracking key metrics allows you to measure the adoption and success of your HR processes and programs like diversity, equity, inclusion, and belonging (DEIB) efforts, leadership development, or employee wellbeing initiatives, so you can understand what’s working, identify opportunities for improvement, and know when it’s time to sunset a program.
When used thoughtfully, HR metrics help turn workforce data into actionable insights, empowering the HR function to respond strategically in the always-changing world of work.
Types of HR Metrics
There are HR metrics for just about anything you can think of, but to help you stay focused and organized, we’ve listed the core categories most fall into:
- Workforce composition and size: Tracks headcount, diversity, and demographics
- Talent acquisition: Measures hiring metrics like time to fill, cost per hire, and overall recruitment costs and efficiency
- Engagement and experience: Monitors employee satisfaction, engagement, sentiment, and employee Net Promoter Score (eNPS)
- Performance and productivity: Assesses individual and team output, quality of hire, and performance ratings
- Compensation and benefits: Evaluates pay equity, total rewards, and benefits utilization
- Workforce planning and mobility: Tracks internal movement, succession planning, and future talent needs
Together, these metrics give HR teams and business leaders a comprehensive view of their workforce — helping them make smarter decisions driven by data at every stage of the employee journey.
Need help keeping these important HR functions top of mind? Our HR Metrics Cheat Sheet breaks down core key performance indicators (KPIs), definitions, and industry average benchmarks — all in one easy-to-use resource.
{{rich-highlight-2}}
17 Key HR Metrics and KPIs Worth Tracking
Whether you’re focused on growth, budget management, performance improvement, or strengthening company culture, tracking the right HR metrics and KPIs is essential for making informed, strategic decisions. To support you, we’ve rounded up some of the most impactful metrics — along with how to calculate them and why they matter — so you can lead with greater clarity and confidence.
Headcount
Employee headcount measures the size of your workforce, which is necessary to determine turnover, employee retention, and whether your organization is growing or shrinking. Tracking headcount also helps inform future hiring needs, forecast costs, and ensure the right resources are in place to support business goals.
How to Calculate Employee Headcount
\( \textit{Total employee headcount} = (\textit{Number of full-time employees}) + (\textit{Number of part-time employees}) + (\textit{Number of temporary/contract workers}) \)
Employee Headcount Calculator
Total Employee Headcount: 0
Time to Fill
Another key recruiting metric, time to fill measures how long it takes to hire for an open role. It helps recruiting teams identify and fix bottlenecks in the hiring process, creating a faster, more efficient experience for both candidates and hiring managers.
How to Calculate Time to Fill:
To calculate time to fill for an individual role, use this formula:
\( \textit{Time to fill} = (\textit{Day the offer was accepted}) - (\textit{Day the position was posted}) \)
If you want to find the average time to fill across your past open roles, start by defining the time period you want to measure. For each position filled during that period, calculate the number of days between the job opening and the offer acceptance dates. Then, add up all those durations and divide by the number of roles filled to get your average.
\( \textit{Average time to fill} = \frac{\textit{Total number of days to fill all positions}}{\textit{Number of positions filled during the period}} \)
Time to Fill Calculator
Time to Fill: 0 days
Average Time to Fill Calculator
Average Time to Fill: 0 days
Employee Net Promoter Score (eNPS)
Employee Net Promoter Score measures how likely employees are to recommend your company as a great place to work. Employees respond to the question “How likely are you to recommend your company as a place to work?” on a scale of 1 to 10:
- Scores of 1-6 are considered detractors
- Scores of 7-8 are passives
- Scores of 9-10 are promoters
Tracking eNPS helps your organization gauge employee loyalty and monitor changes in sentiment over time.
How to Calculate eNPS
Start by calculating the percentage of promoters and detractors from your eNPS survey results with the following formulas:
\( \textit{Promoters (\%)} = \frac{\textit{Number of employees who responded with a 9 or 10}}{\textit{Total number of eNPS survey respondents}} \times 100 \)
\( \textit{Detractors (\%)} = \frac{\textit{Number of employees who responded with a score of 1 through 6}}{\textit{Total number of eNPS survey respondents}} \times 100 \)
Once you have both percentages, use this formula to calculate your eNPS:
\( \textit{Employee Net Promoter Score} = (\%\textit{ of promoters}) - (\%\textit{ of detractors}) \)
Promoter/Detractor Calculator
Promoters: 0%
Detractors: 0%
Employee Net Promoter Score Calculator
Employee Net Promoter Score: 0
Turnover Rate
While some employee turnover is inevitable, it’s in your organization’s best interest to retain talent. Tracking turnover rates over time can help you spot and resolve concerning trends that may signal deeper issues within your culture or work environment, so you can improve retention and keep employees engaged.
Turnover rate measures the percentage of employees who leave your organization during a given period, specifically those you intend to replace. It includes two types of departures:
- Voluntary turnover refers to employees who leave your workforce by choice, whether to retire, join another organization, join the military, relocate, or pursue other opportunities.
- Involuntary turnover refers to employees who are fired or laid off by your organization, often due to poor performance, disciplinary issues, or organizational changes like downsizing.
How to Calculate Turnover Rate
First, calculate average employee headcount using this formula:
\( \textit{Average employee headcount} = \frac{(\textit{Headcount at the beginning of the period}) + (\textit{Headcount at the end of the period})}{2} \)
Then, use that number in the denominator of this formula to calculate your employee turnover rate:
\( \textit{Employee turnover rate (\%)} = \frac{\textit{Total departures in a period}}{\textit{Average employee headcount that period}} \times 100 \)
Turnover Rate Calculator
Turnover Rate: 0%
Attrition Rate
Attrition rate also tracks employee departures but focuses on roles your organization chooses not to backfill. While high turnover can signal cultural or management issues, high attrition may suggest an aging workforce, shifting organizational priorities, or a risk of lost knowledge. It can help your organization take a more strategic approach to workforce planning and ensure you have enough skilled talent to achieve your goals.
How to Calculate Attrition Rate
Still unclear on the differences between turnover and attrition? Check out our turnover versus attrition guide for help decoding two of HR’s most important metrics.
Attrition Rate Calculator
Attrition Rate: 0%
Absenteeism Rate
The absenteeism rate measures how many workdays employees miss over a specific time period. High absences can signal deeper issues such as low engagement, burnout, workplace stress, or dissatisfaction, so periodically checking this metric can help your HR team identify concerning trends and address underlying causes.
How to Calculate Employee Absenteeism Rate
\( \textit{Employee absenteeism rate (\%)} = \frac{\textit{Total number of missed workdays}}{\textit{Total number of workdays in the period}} \times 100 \)
Employee Absenteeism Rate Calculator
Absenteeism Rate: 0%
Top Performer Retention Rate
It’s not just about retaining employees — it’s about retaining the right employees. Top performer retention rate measures how many of your high-performing team members stay with your organization over time. Tracking this metric helps your business understand whether you’re keeping top talent engaged, supported, and motivated to grow within your company. While retention varies by industry and the nature of work being performed, you’ll generally want to aim for a rate of 90% or higher.
How to Calculate Top Performer Retention Rate
\( \textit{Top perf. retention rate (\%)} = \frac{\textit{Number of top performers at end of the period}}{\textit{Number of top performers at start of the period}} \times 100 \)
You can also use this formula to calculate your organization’s overall retention rate — just swap in your total employee headcount instead of the number of top performers.
Top Performer Retention Rate Calculator
Top Performer Retention Rate: 0%
Quality of Hire
Quality of hire evaluates the efforts of your recruiting team. Are they bringing in the right talent? Are these new hires performing well? Are they staying with the company? By tracking this metric over time, your organization can identify when recruitment processes need improvement, so you can consistently make stronger, more effective hires.
How to Calculate Quality of Hire
There are a few ways to measure this metric, depending on which variables you want to include, like job performance, retention, productivity, ramp-up time, cultural fit, and more. First, define the indicators you care about most, then input them in the equation below:
\( \textit{Quality of hire} = \frac{(\textit{Variable 1 [\%]}) + (\textit{Variable 2 [\%]}) + (\textit{Variable 3 [\%]}) + \ldots}{\textit{Number of variables included}} \)
Quality of Hire Calculator
Average Performance Rating
The average performance rating metric assesses how the typical employee is performing across your business. This metric provides insight into overall workforce performance, helps track trends over time, and can reveal whether performance management programs and training programs are having the desired impact.
How to Calculate Average Performance Rating
\( \textit{Average performance rating} = \frac{\textit{Sum of all employee performance ratings}}{\textit{Total number of ratings}} \)
Average Performance Rating Calculator
Average Performance Rating: 0
Career Path Ratio
Career path ratio tracks employee career progression by measuring the ratio of promotions to lateral moves within your organization. This helps businesses understand how employees are advancing, identify opportunities to strengthen internal mobility, and ensure career development paths are supporting employee growth.
How to Calculate Career Path Ratio
\( \textit{Career path ratio} = \frac{\textit{Total number of promotions}}{(\textit{Total number of transfers}) + (\textit{Total number of promotions})} \)
Career Path Ratio Calculator
Career Path Ratio: 0
Revenue Per Employee
Revenue per employee is calculated by dividing an organization’s total revenue by its employee headcount, helping businesses gauge workforce productivity, efficiency, and overall company performance.
How to Calculate Revenue Per Employee
\( \textit{Revenue per employee} = \frac{\textit{Total revenue}}{\textit{Total employee headcount}} \)
Revenue Per Employee Calculator
Revenue per Employee: 0
Comparison Ratio
Also known as compa-ratio, this metric compares an employee’s compensation to the midpoint of their salary range or the average market rate for their role. It helps organizations ensure competitive and equitable pay by revealing how individual salaries compare to market or internal salary midpoints. This enables HR teams to identify underpaid or overpaid employees, guide compensation adjustments, support fair pay practices, and maintain employee motivation and retention.
How to Calculate Compa-Ratio
\( \textit{Comparison ratio (\%)} = \frac{\textit{Individual's salary}}{\textit{The midpoint of their pay band}} \times 100 \)
Compa-Ratio Calculator
Comparison Ratio: 0%
Salary Range Penetration
While compa-ratio compares an employee’s salary to the midpoint of the range, salary range penetration measures where the employee’s pay falls within the full salary range — from minimum to maximum. This helps businesses understand if an employee’s compensation is near the bottom, middle, or top of the range, offering valuable insights to ensure fair and competitive pay decisions.
How to Calculate Salary Range Penetration
\( \textit{Salary range penetration (\%)} = \frac{(\textit{Individual's salary}) - (\textit{Salary range minimum})}{(\textit{Salary range maximum}) - (\textit{Salary range minimum})} \times 100 \)
Salary Range Penetration Calculator
Salary Range Penetration: 0%
Total Cost of Workforce
The total cost of workforce adds up all the costs associated with employing your people (like salaries, benefits, taxes, and other related expenses) so your business can understand its total investment in talent. Tracking this helps you manage workforce spending and keep rising costs from negatively impacting the business.
How to Calculate Total Cost of Workforce
\( \textit{Total cost of workforce} = (\textit{Cost of salaries, overtime, taxes, benefits}) + (\textit{Additional labor costs}) \)
Total Cost of Workforce Calculator
Total Cost of Workforce: $0
Manager Effectiveness
Manager effectiveness is an advanced metric as there’s no one-size-fits-all formula. Instead, each organization should create its own manager effectiveness index by assigning weights to different factors that reflect what matters most to the business.
For example, you might measure manager effectiveness using a combination of team engagement score, goal completion rate, median team performance score, voluntary turnover rate, and more.
How to Measure Manager Effectiveness
\( \textit{Manager effectiveness score} = (\textit{Weighted variable 1}) + (\textit{Weighted variable 2}) + \ldots \)
It’s important to customize this formula based on your organization’s goals and values. Some companies may emphasize engagement, while others prioritize team performance, retention, or leadership development.
Check out our Manager Effectiveness Cheat Sheet for five essential steps to ensure your managers have the support, tools, and clarity they need to thrive.
Manager Effectiveness Calculator
Diversity (Representation)
To understand how different groups are represented in your workplace, calculating diversity can tell you what percentage of your workforce falls into specific demographic categories (such as gender, race/ethnicity, age, disability status, and more). Of course, representation is only part of the picture. You’ll also need to focus on creating an inclusive environment where all employees feel valued, supported, and able to thrive in order to retain talent from underrepresented demographics.
How to Calculate Workplace Diversity
\( \textit{Diversity (\%)} = \frac{\textit{Number of employees in a specific demographic group}}{\textit{Total number of employees}} \times 100 \)
Diversity/Representation Calculator
Diversity: 0%
Span of Control
Span of control measures how many direct reports each manager has. If the ratio is too high, managers may struggle to give employees the attention, support, and feedback they need to thrive. There is no magic number when it comes to span of control. Every case is different and depends on factors like the manager’s capacity, the complexity of the work, and how independently employees can operate. While some teams function well with a handful of direct reports, others may thrive with a larger span, depending on the level of oversight required.
How to Calculate Span of Control
\( \textit{Span of control} = \frac{\textit{Number of employees}}{\textit{Number of managers}} \)
Calculating HR metrics is only half the job — the other half is presenting them clearly to your leadership team and answering their key questions. Need help making your deck boardroom-ready? Our HR Metrics Slide Deck Template includes more than 50 editable charts and covers all the essential metrics, from headcount to time to fill.
Span of Control Calculator
Span of Control: 0
How Lattice Analytics Helps Businesses Turn HR Metrics into Action
Mastering HR metrics doesn’t require memorizing formulas. Partnering with a unified people platform, like Lattice, automates the calculation, tracking, and visualization of key people metrics over time, enabling smarter, more informed decision-making.
Disconnected tools and data silos often mean inconsistent reporting, manual processes, and costly errors. By integrating HRIS, payroll, performance, and engagement data into a single system, Lattice turns fragmented data into real-time insights, empowering your HR team to move from reactive to strategic.
Here’s a closer look at how Lattice tools help HR leaders get more from their people analytics:
1. Engagement Surveys
Lattice Engagement helps businesses gather both qualitative and quantitative feedback across the entire employee lifecycle. From onboarding to engagement to exit surveys, companies can better understand all aspects of the employee experience — and save time analyzing results with Lattice’s AI-powered insights.
2. Analytics for DEIB
Lattice’s DEIB Analytics dashboard surfaces DEIB gaps by showing representation and engagement data across demographic groups. This helps organizations take action to create more equitable processes and initiatives for underrepresented talent.
{{rich-highlight-3}}
3. Adoption Dashboard
Lattice’s Adoption Dashboard tracks tool usage — such as Lattice 1:1s, Feedback, and Engagement participation — giving HR visibility into employee adoption and overall ROI. These insights help HR teams identify when additional training or awareness is needed to boost adoption and maximize the impact of their people platforms.
4. Team Analytics
With Lattice’s Team Analytics, people leaders gain granular visibility into team sentiment, performance, development, and manager effectiveness, helping them proactively identify coaching needs, celebrate successes, and shape healthy team cultures.
With HR dashboards for diversity and inclusion, performance equity, employee sentiment, and more, Lattice Analytics helps HR teams and leaders build a happier, healthier, and higher-performing workplace.
Want to see the platform in action? Here’s how one company used Lattice to turn HR metrics into measurable improvements in recognition, retention, and engagement.
HR Metrics and Lattice in Action
When grant management software and consultancy company NPact first launched its HR department, it faced a disconnected culture, siloed teams, and poor communication. After NPact implemented Lattice to strengthen empathy and collaboration, the company saw:
- A 45.6% increase in employee recognition over two years
- A 6% decrease in voluntary turnover
- Employees rating their overall engagement with the company above 90%
These key HR metrics helped the NPact team clearly demonstrate both the impact of their initiatives and the value of using the Lattice people platform.
Ready to unlock the power of HR analytics and metrics alongside Lattice? Request a demo today and learn how a unified people platform can help your business drive smarter, data-driven decisions.
{{rich-highlight-1}}
HR Metrics FAQs
What are the most common metrics used by HR?
While the specific metrics an organization tracks will vary, there are a few common HR metrics most organizations consistently measure and track. These metrics include employee headcount, turnover rate, cost per hire, revenue per employee, and employee Net Promoter Score.
How can HR systems and processes be improved by advanced metrics?
Advanced metrics give businesses deeper insights into their people and workplaces, allowing them to make more informed decisions, design more effective programs, and proactively address risks. The result? A better employee experience and stronger alignment between your people strategy and business goals.
What are a few examples of these advanced metrics?
More advanced HR teams often track deeper insights meant to inform strategic decisions. Examples include quality of hire, career path ratio, manager effectiveness, and pay equity.
What is the cost-benefit analysis of analyzing advanced metrics?
Tracking advanced HR metrics requires time, tools, and resources, especially when it comes to collecting and analyzing data. However, the payoff can be significant. With the insights HR metrics provide, businesses can make more informed, data-driven decisions like targeting investments where they’ll have the greatest impact, refining or stopping costly and ineffective initiatives, and ultimately driving better financial and social outcomes for both employees and the business.
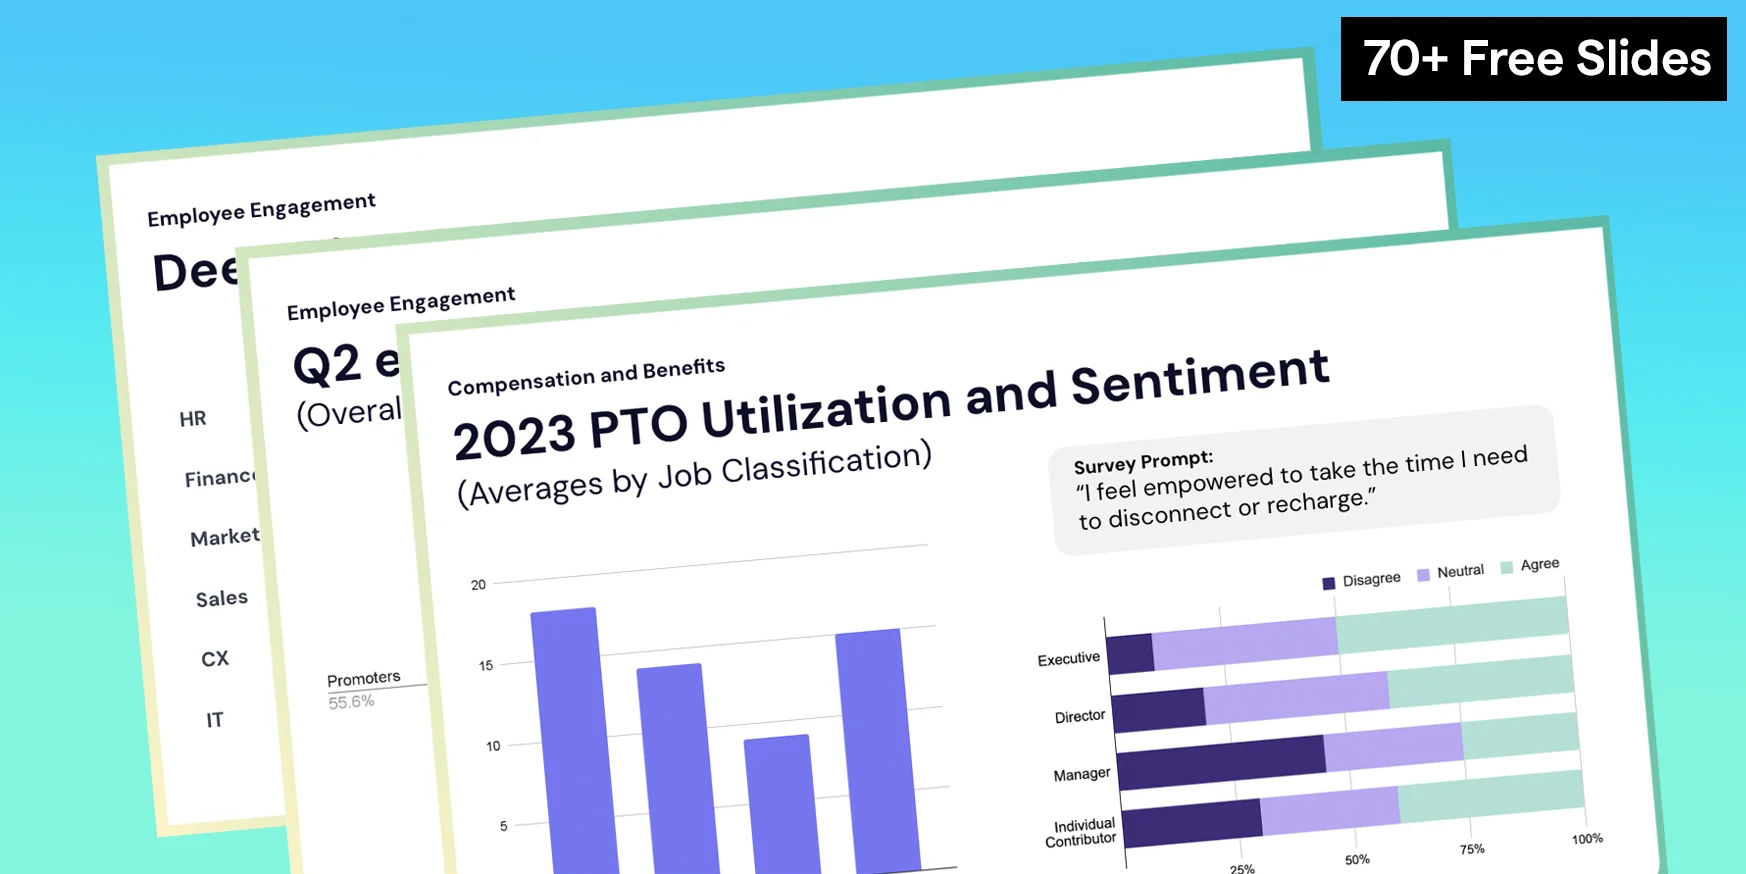
📊 Free Resource: HR Metrics Slide Deck Template
Don't just report on the numbers, tell a story. Our free slide deck template features over 70 slides you can leverage to present on time to fill, eNPS, retention rates, and much more. Even your CFO will be impressed.
📈 Make confident, data-driven people decisions.
HR insights are business insights. Maximize performance, productivity, and engagement across your workforce with Lattice's advanced people analytics.

.webp)